If you are weighing Cupertino schools against your housing budget, you are not alone. Many buyers here try to balance top-rated public schools with commute time, lot size, and total cost. You want a clear, data-backed way to compare tradeoffs so you can act with confidence. In this guide, you will learn how school boundaries work, what price tiers look like today, and how commute patterns can shift your options. Let’s dive in.
How school boundaries work
Cupertino’s K–8 schools are in the Cupertino Union School District (CUSD), and high schools are in the Fremont Union High School District (FUHSD). School assignment is address-based, and boundaries can cross city lines. The fastest way to confirm the exact schools for a property is to use the district tools.
Do not rely on city name or ZIP alone. Parts of Sunnyvale, San Jose, Los Altos, and Saratoga also fall within these districts. Always confirm by property address on the district sites.
Measuring school quality
If you want an objective read on school performance, use the California School Dashboard. It reports comparable indicators such as English language arts, math, college and career readiness, and graduation rates. Many FUHSD high schools, including Monta Vista, Lynbrook, Cupertino, and Homestead, post strong results on these measures.
- Review district performance and school-level indicators on the California School Dashboard. Be sure to note the year and the specific metric you are using.
Use neutral, factual language when discussing schools. Focus on the data point and the date it was reported.
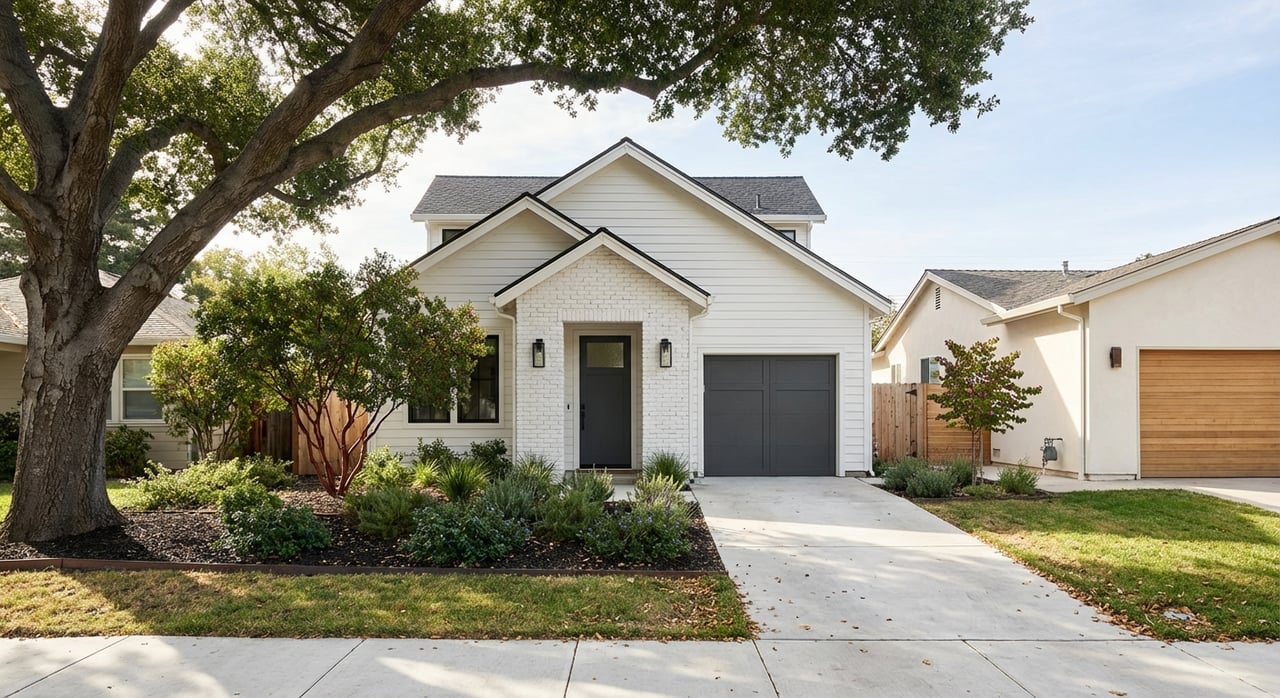
What homes cost by pocket
Cupertino is a high-priced market. Major trackers placed the city’s median in the low-to-mid millions as of late 2025 and early 2026. Prices vary by product type, lot size, and exact pocket within a school attendance area.
Below are typical late-2025 to early-2026 ranges that help frame expectations. Treat these as directional and confirm with recent solds around a specific address and attendance area.
| Pocket type |
Typical price band |
Often feeds to (examples) |
Typical homes |
Commute notes |
| Top-tier school pockets |
≥ $3.0M, many sales in $3M–$6M+ |
Monta Vista or Lynbrook areas |
Larger lots, updated ranch, hillside or view homes |
May add minutes to freeway access depending on hillside or interior location |
| Upper-middle pockets |
~$2.0M–$3.5M |
Many Cupertino High and some Homestead areas |
Mid-sized lots, established tracts, remodel potential |
Often closer to I-280 or SR-85 for regional access |
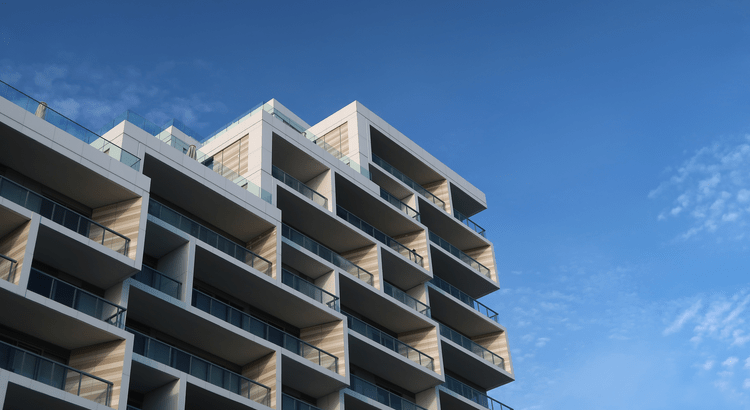
| Mid or entry pockets, plus attached |
~$1.0M–$2.2M |
Mix of feeders; verify by address |
Townhomes, condos, small lots, or older homes |
Shorter commute in some cases, but school feeders vary |
Important notes:
- Attendance boundaries cut across neighborhood names and ZIP codes. Always verify assignment using the district tools.
- Market data change quickly. When you pull comps, label the time window and whether you are citing listing or sold prices.
Commute tradeoffs to consider
The mean travel time to work for Cupertino residents is about 24.8 minutes, based on the latest American Community Survey estimate. You can use this as a baseline when judging how a school choice might alter your daily routine. See the current figure on Census QuickFacts.
Major corridors shape daily travel: I-280, State Route 85, Stevens Creek Boulevard, Foothill Expressway, and De Anza Boulevard. Cupertino does not have a Caltrain station in city limits, and the nearest stations are in Sunnyvale and Mountain View. For a quick overview of the city context, review the Cupertino overview.
Example lens to apply:
- If you accept a 10 to 20 minute longer commute, you may access a larger pool of homes in some Monta Vista or Lynbrook attendance pockets.
- Living close to Apple Park or De Anza College can reduce commute time, though it may place you in a different K–8 feeder or a Homestead or Fremont High assignment. Always verify by address before you decide.
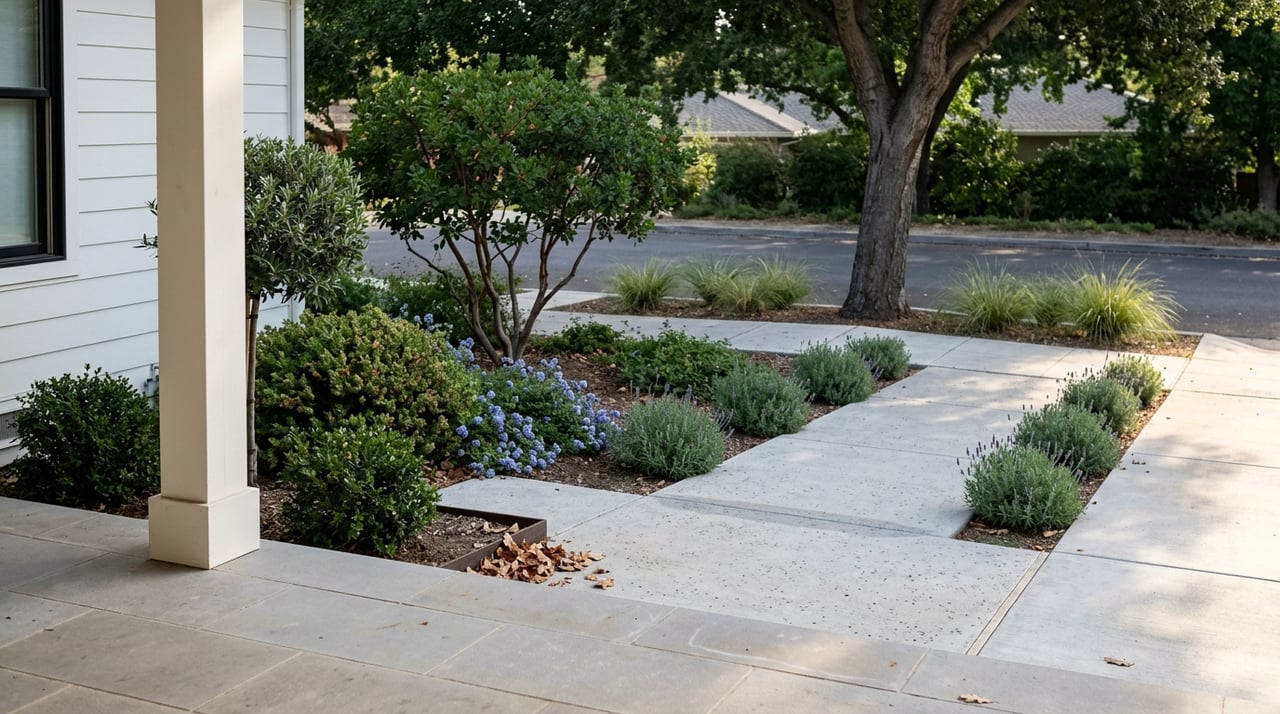
For families evaluating walk and bike options to school, the City of Cupertino provides suggested walking and biking routes by campus.
A simple, repeatable method for price checks
To compare cost across attendance areas with confidence, follow this workflow:
- Confirm assignment by address. Use the CUSD School Locator for K–8 and FUHSD’s boundary tools for high school.
- Define the geography. Use the district map to outline the attendance area or build a list of recent solds inside the boundary.
- Pull sold data for the last 6 to 12 months. Record median sale price, median price per square foot, number of sales, and days on market. Label the date window and the data source.
- Compare more than one area. Show ranges, not just a single point, to reflect variability by lot size, remodel level, and product type.
This approach keeps your analysis tied to the actual assignment area rather than neighborhood nicknames or ZIP codes.
Buyer scenarios: gain and give up
Here are three common ways buyers make tradeoffs:
- Stretch for a top-tier high school. You target Monta Vista or Lynbrook-fed pockets, accept a higher price band, and budget for potential remodel costs. You may add time to your commute, especially if the home sits away from the freeways.
- Balance commute and price. You focus on upper-middle pockets that often feed Cupertino High or Homestead. You aim for mid-sized lots, good freeway access, and a strong overall value.
- Start with attached or smaller single-family. You enter the market in the $1.0M–$2.2M range, verify school feeders carefully, and use a 5 to 7 year plan to trade up once equity builds.
Tips to compete in tight inventory
Inventory in Cupertino tends to be tight, which can amplify the school premium. A clear plan puts you in position to move when the right address appears.
- Get fully underwritten and know your walk-away price before touring.
- Pre-approve your improvement budget if you plan to remodel. Many homes trade based on potential.
- Widen your search to adjacent attendance areas and compare commute deltas in minutes, not miles.
- Monitor on-market and private channels to see homes early. Tight buyer timelines can favor prepared offers.
If you want a data-backed search and early access to curated inventory, connect with NOOPUR GUPTA for a focused strategy that blends neighborhood analytics with high-touch execution.
Bottom line
In Cupertino, school assignment, budget, and commute form a three-way tradeoff. Use district address tools to confirm feeders, rely on objective performance data, and compare recent solds inside each attendance area. When you frame the decision in numbers and minutes, you can act quickly and with confidence.
Short disclaimers: School boundaries and programs can change. Always verify assignment on the district sites before you make a decision. Market conditions evolve quickly, so date and source any price figures you use.
FAQs
How do I confirm a Cupertino home’s assigned schools?
Which districts serve Cupertino and nearby pockets?
- K–8 is served by CUSD and high school by FUHSD; both districts include areas of neighboring cities, so always verify by address rather than city or ZIP.
What objective source should I use for school performance?
How much more do top attendance areas usually cost?
- As a general frame, single-family homes in top-tier pockets often start around $3.0M, with many closing between $3M and $6M+, while other areas range lower; confirm with recent solds near a specific address.
What is the average commute time in Cupertino?
- The mean travel time to work is about 24.8 minutes per Census QuickFacts, though your commute will vary by proximity to I-280, SR-85, and major arterials.
Does Cupertino have a Caltrain station?
- No. The nearest stations are in Sunnyvale and Mountain View; local travel relies on I-280, SR-85, and arterial corridors within Cupertino.